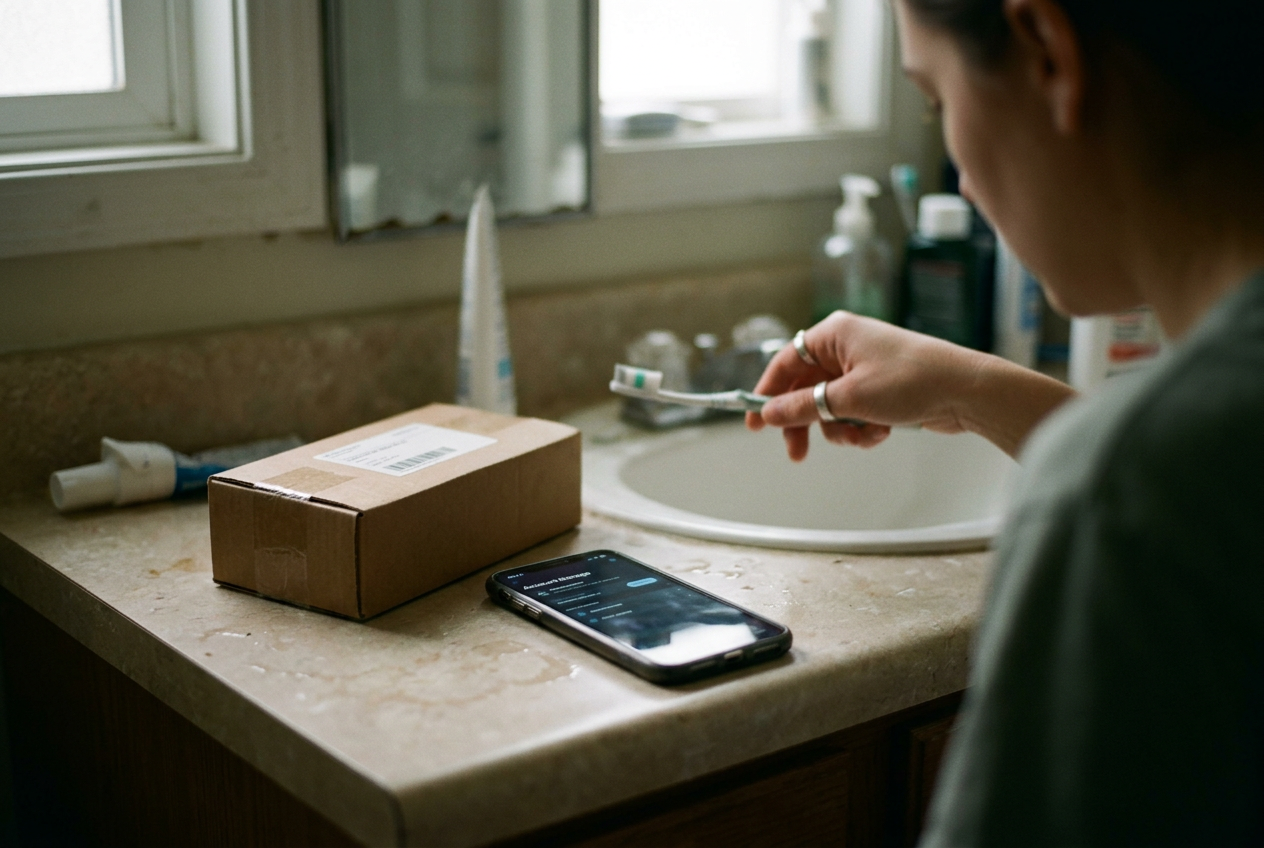
At-Home Hormone Tests Sell a Dashboard, Not a Diagnosis
The sample may produce a valid measurement. The trouble starts when a polished interface turns one moment in a fluctuating system into a story about fertility, stress or hormonal health.
August 11, 2026 · 8 min read
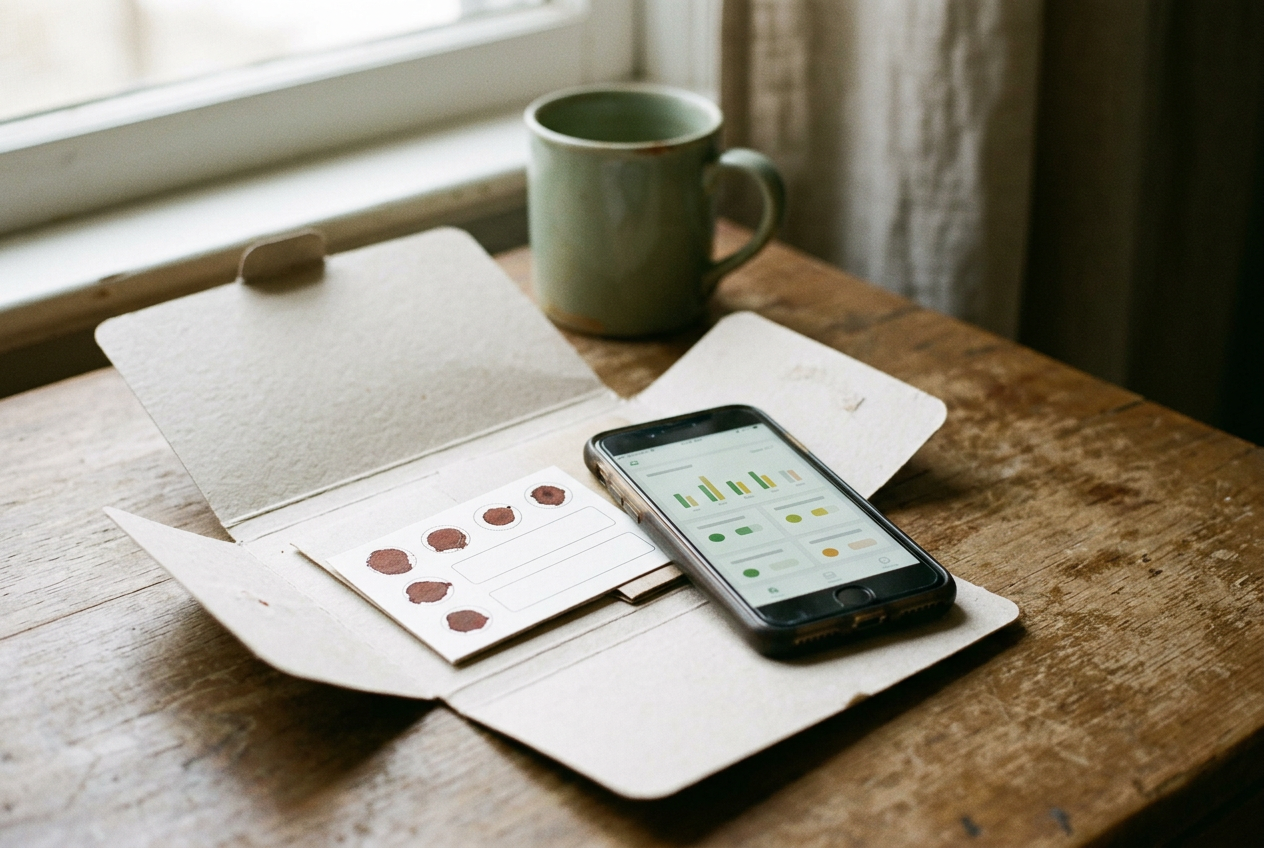
The object that explains this business is a dried-blood-spot card shown in the Everlywell Women’s Health Test materials. It is absorbent paper printed with circles that must be saturated with blood from a finger prick, dried and returned to a laboratory alongside saliva samples collected according to the kit’s schedule.
The card looks definitive. Fill the circles. Send it away. Receive answers.
Yet the card records something narrower: a specimen collected by one person, at one time, under conditions the laboratory cannot fully observe. The lab can measure the biomarkers included in the panel. It cannot recover sleep, medication use, menstrual-cycle timing, a difficult collection or the reason the customer bought the test. Those gaps matter because hormones fluctuate, sometimes across a day and often across a cycle.
Everlywell is not alone in packaging those measurements as a consumer journey. LetsGetChecked sells home hormone panels built around mailed samples. Modern Fertility, offered through Ro, has marketed ovarian-hormone testing with results presented through a digital account. Mira sells a urine-testing system designed for repeated hormone tracking.
Their specimens, intended uses and interfaces differ, but the commercial grammar is remarkably stable: identify symptoms, collect data, view a personalized interpretation, then keep measuring.
This analysis follows the ordering flows, collection instructions and sample-result materials available for those products, with the Everlywell blood-spot card as the central case. No personal specimen was submitted. This is reporting, not professional medical advice.
The quiz starts building the answer
The customer journey usually begins before a lancet appears. A quiz asks about irregular periods, fatigue, sleep, mood, weight changes, sex drive, fertility plans or a general sense that something is off. These are common experiences with many possible causes. Inside a sales funnel, however, they become evidence that a hormone panel belongs in the cart.
That distinction is easy to miss because the quiz borrows the tone of clinical intake without doing the same job. A clinician uses questions to narrow possibilities, identify urgency, select an appropriate test and decide whether testing is useful at all. A retail quiz routes the customer toward a product the company already sells. It may help someone choose between panels, but it does not provide a differential diagnosis, which is the process of weighing several plausible causes for the same symptoms.
The mechanism works because the quiz supplies narrative before the laboratory supplies numbers. By the time the customer reaches checkout, fatigue and acne may already feel joined under the label of hormonal imbalance, a popular phrase with no single agreed diagnostic meaning. The result page then inherits that framing, even when the measured values cannot establish the cause of either symptom.
This is a powerful piece of interface design. The company does not need to promise a diagnosis. It can place symptom language, biomarker descriptions and personalized recommendations close enough together that the customer performs the final inference.
The collection card carries hidden conditions
Return to the dried-blood-spot card. Its circles convert a bodily task into a pass-fail visual: enough blood or not enough, fully saturated or visibly incomplete. The simplicity is useful, but it hides preanalytical variables, the factors introduced before a specimen reaches the laboratory.
Finger temperature, blood flow, drying time, contamination, storage and shipping can affect specimen quality. Saliva collection adds its own instructions around timing, food, drink and oral contamination. Urine-based fertility monitors depend on when testing occurs and how concentrated the urine is. A laboratory may reject an unusable specimen, which is preferable to reporting unreliable data, yet a specimen that passes quality checks still represents only the conditions under which it was collected.
Cycle timing creates a deeper interpretive problem. Estradiol, luteinizing hormone and follicle-stimulating hormone change across the menstrual cycle. Progesterone becomes meaningful in relation to ovulation and timing. Cortisol follows a daily rhythm and responds to acute conditions.
Hormonal contraception, fertility medication, pregnancy, perimenopause and other factors can change what a result means.
The instructions acknowledge some of this through timed collection windows and eligibility language. The sales page has a harder task: it must make the kit feel easy enough to buy while the instructions must admit that the biology is conditional. The card sits between those promises. It makes the sample portable, but it cannot make the context portable with equal precision.
Several tests also use different specimen types or laboratory methods, which means two numbers carrying the same hormone name are not automatically interchangeable. A trend line looks coherent when an app draws it in one color. Its clinical meaning depends on whether the samples, timing and methods support comparison.
The lab measures an analyte. The interface writes a story
A result commonly arrives as a number beside a reference interval, the range observed in a defined comparison population under a laboratory’s method. Values inside that interval may receive reassuring colors. Values outside it may receive warning colors and explanatory text.
Reference intervals are useful. They are not universal borders between healthy and ill. A value can fall outside a range in a healthy person, while a value inside it can still require attention when symptoms, medications or other findings change the picture. Some hormones also need to be interpreted together or at a particular cycle stage, rather than treated as isolated scores.
The dashboard tends to flatten those complications because dashboards are built to reduce friction. Green means settled. Red means action. A paragraph beneath the result may mention context, but color and position have already delivered the stronger message.
Modern Fertility’s framing has emphasized fertility information, including measures such as anti-Müllerian hormone, or AMH, a marker used in clinical settings partly to estimate ovarian response to stimulation. AMH alone does not provide a direct forecast of whether someone will conceive naturally. A consumer may understand “ovarian reserve” as a countdown clock because the interface places a personal value inside age-based comparisons, even when the accompanying explanation uses more restrained language.
Mira’s repeated urine measurements solve a different problem by showing patterns rather than relying on one mailed snapshot. Repetition can be useful for identifying a hormone surge associated with ovulation. It can also produce more points to inspect, more apparent anomalies and more reasons to continue testing. The chart becomes the product’s daily environment.
The Everlywell blood-spot card reaches the same destination by mail. Once its measurements enter a dashboard, the awkward specimen disappears. There is no cooling fingertip, drying rack or uncertain circle on screen. There is a clean panel whose visual authority exceeds the messiness of collection.
Uncertainty is the subscription opportunity
A single test has a commercial weakness: the customer can leave. A dashboard creates reasons to remain by offering trends, retesting, educational content, consultations or related products. If a value looks unusual, the customer may want confirmation. If everything looks normal but symptoms continue, another panel can appear to promise a wider search.
If the test captures a fluctuating hormone, repetition can be presented as better self-knowledge.
The companies are selling laboratory access, logistics and software, all of which cost money to provide. The sharper issue is whether recurring measurement answers a defined health question or merely keeps uncertainty active. A subscription benefits when the customer’s state never feels fully resolved, because each result can become a baseline for the next result rather than an endpoint.
This helps explain why the symptom quiz matters so much. It gives the customer an unresolved story. The sample gives that story numbers. The dashboard arranges the numbers into status, and the upsell offers continuity.
What the card can still do
At-home collection can lower practical barriers for people who cannot easily schedule an appointment, travel to a draw site or persuade a clinician to take persistent symptoms seriously. A clearly abnormal result may prompt a useful conversation. Repeated testing ordered for a specific reason can also produce actionable information when collection timing and interpretation are appropriate.
None of that requires treating the dashboard as a diagnosis. The useful question is narrower: what was measured, by which method, from what specimen, at what time, and what decision can this result reasonably support? Those details are less satisfying than a wellness score. They are also where the information lives.
The dried-blood-spot card deserves the same modesty. It is a clever transport system for a small biological sample. It does not carry a complete account of the person who filled it.
Questions people ask
Can an at-home hormone test diagnose PCOS, perimenopause or infertility?
A hormone result may contribute information, but these conditions are not established by a consumer dashboard alone. Diagnosis can depend on symptoms, history, examination, imaging, repeated measurements or other laboratory work, and the relevant combination differs by condition. A normal-looking panel also cannot rule out every cause of ongoing symptoms.
Why might my hormone result change between tests?
Hormones can vary with cycle stage, time of day, pregnancy, medication, hormonal contraception and acute conditions. Collection and laboratory methods matter too. A changed number may reflect biology, timing or specimen differences, so a trend line is most informative when the underlying tests were collected under comparable conditions for a defined purpose.
Are at-home hormone tests useless?
No. They can improve access, document selected biomarkers and give someone information to discuss with a qualified professional. Their value drops when broad symptoms are treated as proof of a hormone problem, or when the interface implies that a reference range can explain fertility, mood, weight or fatigue by itself.
What does the subscription add?
It may add discounted retesting, trend storage, consultations or access to related products, depending on the service. It also converts one purchase into an ongoing relationship. Before another dried-blood-spot card arrives, the unresolved issue is whether repeat measurement serves a specific question or merely supplies another dashboard update.
One update a day
Today's story, in your inbox
One story each morning — no hype, no filler, no algorithm deciding for you.